Summer vs Winter solar harvest (min/max)
[update: I wrote this in a sloppy brain-fog and returned on 12/15 later to clean it up a bit. Mea culpa.]
It’s widely observed that solar harvest in winter is lower than summer but I’ve never run the numbers for any given setup. This twitter thread by Sheila’s Wheels got me motivated to sit down and do the math.
I will attempt to quantify the difference so others might know what to expect. To make the differences clearer I will look at max output and overall yield on the worst day in winter (winter solstice) and best day in summer (summer solstice).
variables affecting our harvest
There are many variables affecting solar harvest; here we will only look at a few that come into play winter vs summer.
cell temperature derating
Solar panels make less power as they get warmer; this happens because cell voltage decreases as cell temperature increases. The problem is doubly-impactful because the cells themselves run much hotter than ambient temps, typically ambient+50F. After all they are dark objects sitting in sunlight. The upshot is that a panel whose back label says Vmp1 is 19v under lab conditions2. might have an observed Vmp of 16.6v at 20C/68F3. This calculator will do the math for you.
Related concepts:
- this is why we airgap panels. Airflow under the panel helps remove heated air and allows for cooler cell temperatures.
- cell temp is significantly higher than ambient temp. A rule of thumb for cells under direct sun is ambient+50F
- this power reduction will affect MPPT much more than PWM controllers, as PWM wasn’t using the excess voltage4 anyhow.
Since I am following mild weather cell temperature will have less of an effect compared to staying in once place where the seasonal temp swings would be much wider.
hours of daylight
In winter both the quantity (clock hours) and quality (see below) of sunlight will be limited.
There will be fewest clock-hours of sun5 at the winter solstice and the most at summer solstice. Conveniently enough, the sun is also lowest/highest at the solstices so we can kill two birds with one stone. Read on!
height of sun above horizon
Sunlight will strike a flat-mounted panel at a certain angle at a given time of day on a given date. Using trigometry one can assess how this relates to capturable power. This trig function is the cosine of solar zenith angle (cosine hereafter). This number would be 0.0 when the panel is edge-on to the sun, and 1.0 when the sun is directly overhead. In practice the number is somewhere in-between, something like .7345.
No, you don’t have to do trig standing outside your rig. There are online calculators that will do it for you; here is one from NOAA. By default it assumes current time/date and lets you pick between some major cities. Or you can put in a date/time from the future/past and plug in specific lat/long coordinates.
Example: If the cosine is 0.8 and your flat-mounted panel wattage is 100w then the maximal sunpower available for capture is 80w (100w x 0.8). Note this does not account for local conditions or losses in your solar config.
Related ideas:
- Since the cosine only measures the available sunpower at a given moment it will tell you something like max harvest at local solar noon (which we will look at below) but not overall daily harvest.
- cosine (and yield) will be lower at greater latitudes (closer to the poles). This is why solar power is more popular in Phoenix than in Anchorage.
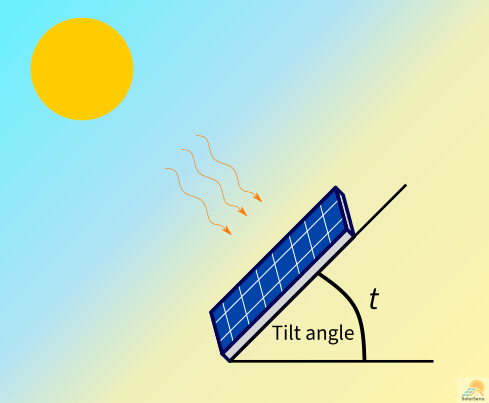
- tilting/panning panels is a common way to get higher cosine values. The sun is falling more perpendicular on the panel (closer to that 1.000 cosine value), as if the panel were flat and the sun more directly overhead
- Precise panel tilt calculations and deployment are crucial for permanently-emplaced solar installs but we mobile folk can generally eyeball with good results. If you want the actual angles you can find them in a calculator. This one is easy and uses major cities – this is close enough for our purposes. This one lets you plug in lat/long.6 This page shows the homework if you curious.
- Tilted panels don’t have to face the same direction. You can angle toward SE if you need more power in the morning, toward the sun’s position at local solar noon if you need peak power (see below), or SW if you need more in the afternoon.7
overall harvest
Together the hours of sun and height of the sun in the sky have effects that have been measured over time. We know the path of the sun at a current place/date but getting numbers from that constantly-changing situation requires either calculus or historical observation. We don’t have to do either of those because NOAA and others do it for us, publishing the results as insolation maps and other forms of data
These datasets indicate Hours of Full Sun Equivalent (FSE) for certain places and times (typically monthly or yearly averages).
FSE makes more sense when we remember that STL (lab testing conditions by which panels are rated) assume the sunlight is 1,000w/m
FSE observations take into consideration local average weather patterns. If you live in a foggy city FSE will be lower than if you live in a sunny city, all other things being equal.
Example: If you have 4.21 hours of FSE and your panel wattage is 100w then you will receive on average ~421 of sunlight on your panels over the course of the day. Again, we are ignoring various real-world losses and actual conditions.
Summer in Colorado vs. Winter in Arizona
Given this information let’s do some projections based on summer in Leadville, Co and winter in Quartzsite, AZ
In both cases I will assume 2% wiring losses and 5% DC-DC buck conversion losses in the MPPT controller. I will also use local average high temps to assess cell temp derating.
summer in Leadville
This should be impressive.
- Summer solstice in 2022 is June 21st
- local solar noon in Leadville at solstice is 1:07pm.
- Average high temperature in June in Leadville is 60F, giving us a cell derating of 10.464%
- cosine of solar zenith angle at local solar noon is 0.9746
- Average FSE in the Leadville are in June is 6.71 hours
Maximum solar harvest at noon == ~608.36w (750w of panel x 0.9742 cosine x 0.93 efficiency after losses x .8953 cell efficiency ). Well within the limits of my 50A controller. The old 40A would start clipping at ~556w.
Maximum daily solar harvest == ~4,190w (750w x 0.93 efficiency x 6.71 hours of FSE x .8953 cell temp )
winter in Quartzsite
This will not be pretty. :-)
- Winter solstice in 2021 is December 21st
- local solar noon in Q at solstice is 12:35pm.
- Average high temperature in December in Q is 65F, cell derating of 11.64%
- cosine of solar zenith angle 0.5463
- Average FSE in the Q area in December is 2.75
Maximum solar harvest at noon == ~336.69w (750w of panel x 0.5463 cosine x 0.93 efficiency after losses x .8836 cell efficiency). Even a 25A controller could handle this.
Maximum daily solar harvest == ~1,717w (750w x 0.93 efficiency x 2.75 hours of FSE x .8836 cell temp )
conclusions
Sheila’s Wheels has the right idea:
Solar works well in summer, not so well in winter months
Overall I’d say my winter solar is less than half of my summer solar.
the theory
Remember we are trying to get at the best case summer vs. worst case winter yields.
My lowest max power in winter is 271.77w lower than (55.34% of) the highest max power in summer.
My lowest daily harvest in winter is 2,473w lower than (40.97% of) the highest daily harvest in summer.
the reality
Reality is a bit squirellier. As my mentor used to say:
In theory, theory and practice are the same. In practice, they are not.
- I’d probably actually be in Leadville in July when the temps are ~70F, but I wanted to use the solstices to show the maximal spread
- FSE numbers were for Denver, not Leadville. I couldn’t find them for leadville proper. Because of the altitude difference Leadville FSE would likely be higher
- Same for Quartzsite, for which I used Phoenix. The FSE should be very close.
- I have 200w of portable panel for poor conditions. If deployed leaning against the van this would add ~139w8 (+41.28%) to the max power in Q and about 382w (+19.1%) to the daily harvest.
Muffin needs a walk
I’ve been indoors for a long while mumbling to myself and crunching these numbers. Muffin is starting at me (potty break signal) so I’ll stop here. Thanks for reading this mess.
comments
twitter comment thread for this post
-
Voltage at which the panel makes maximum power under lab conditions. Vmp in actual use might be called present Vmp. Suggestions welcomed. :-) ↩
-
Standard Testing Laboratory conditions (STL) are cell temps of 25C/77F, which is slightly below freezing ambient. As we know, cell temp > ambient temp. ↩
-
Maybe that’s not big deal. But consider that it is common for MPPT controllers to have a volt or two over battery voltage to do their work. Victron requires +5 to start MPPT but the requirement falls to +1 once underway. Now do the same math for a Vmp 17v panel. D’oh! ↩
-
panel voltage in excess of battery charging voltage ↩
-
ie, sunrise to sunset ↩
-
I find it a bit clunky on linux browsers. I had to toggle the timezone to get it to calculate. ↩
-
paralleled panels or panels on separate controllers can be laid out facing different directions for a more consistent harvest throughtout the day. If max peak power is important both panels would be pointing directly at the sun at local solar noon. ↩
-
The portables sit on a 10A MPPT controller which limits charging to ~139w, depending on Vabs. ↩