PVGIS modeling
I saw a post about the the EU’s off-grid solar modeling system and took it for a whirl.
I modeled both the present 750w system and the previous 570w using my present boondocking spot outside Grand Junction, CO. The model needs to know consumption in Watts, but I don’t know that. Here was my thought process:
- I do know the system[s] have generated an average of 1.55kW/day for the past 1000+ days.
- I do know I typically use 40A overnight out of a 220Ah bank
- I don’t know how much power I consume in loads throughout the day.
- the amount of power generated is equal to user loads + charging loads.
But if I am making 1550W/day, using 500w overnight (~12.5v x 40A) with ~13% charging inefficiencies for SLA, then ~565w is being used for charging. That leaves 985w/day user loads so that’s what I plugged in for consumption.
theory
Both the 570w and 750w systems treated the battery bank about the same; fully charged 96.25% of days on the bigger system vs. 94.26%. Not a big deal.
In theory, the power made each day is estimated to differ by only 9w. One supposes this is because of slightly increased harvest under periods of very low insolation (dawn/dusk).
The bigger story, as one would expect with overpaneled systems of different sizes, is how much power went unused.
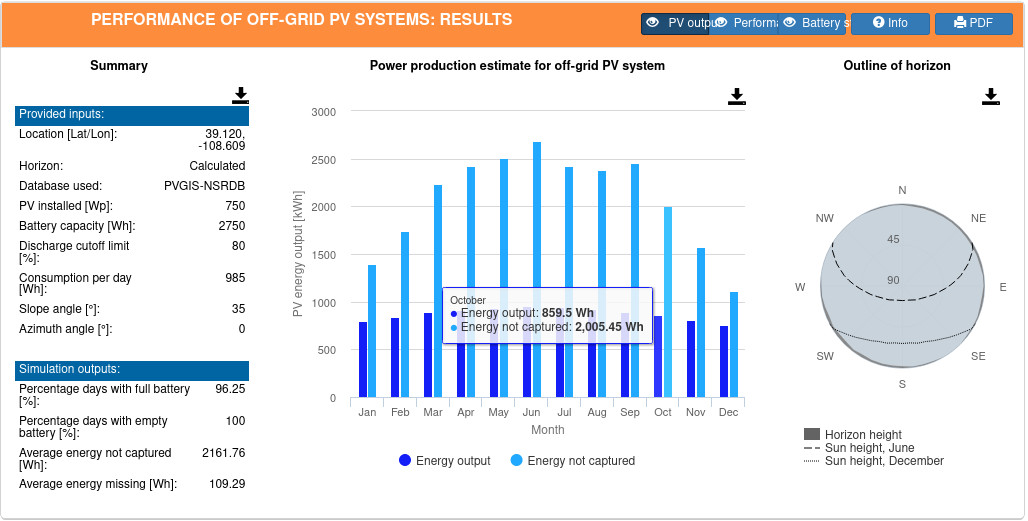
750w:
570w:
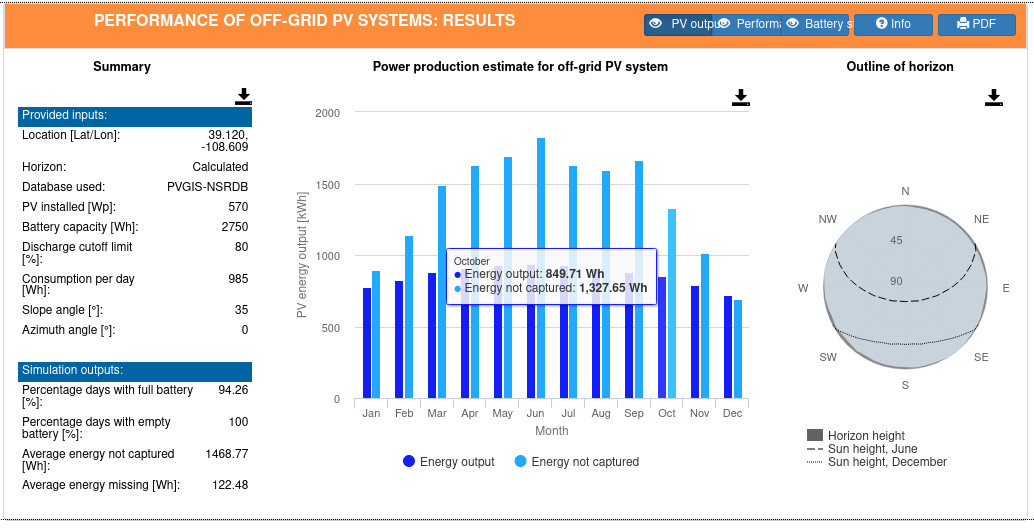
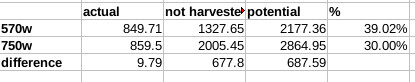 Using October as an example, the 750w system harvested about 30% of what would max at, and the 570w at about 39%. On normal days this makes very little difference; in bad insolation (or when running loads – see below) it can be a noticeable difference.
Note: because the 750w array is on a 40A controller and therefore limited to 588W @ 14.7v, it would be running at bit more than 30% of max during peak production hours if fully loaded.
practice
My actual use over 1000+ days reveals variables the model cannot capture.
overnight consumption varies
In practice my overnight consumption varies between 20% DoD (normal) and 50% DoD (heavy use of heated mattress pad, lighting, laptop use – all pretty rare). Recharging from 50% DoD would take 1,650W instead of 565W as calculated above, +1,085W.
- 750w system had 2,005W/day extra - 1,085 additional charging = 920w surplus if discharged to 50% DoD the night before
- 570w system had 1,328W/day extra - 1,085 additional charging = 243w surplus if discharged to 50% DoD the night before
920w extra is ample. 243w extra makes me nervous.
daytime consumption varies
My daytime use is much less predictable; I might use 500w (bad weather), ~1000w (normal) or 1500w+ (see below). I used the historical 1.55kW/day data because that’s what I have, but it’s not really how I use the system.
cooking with excess power
The biggest differences come when I cook with electricity. Those loads are 75-300w and can run for hours.
I only cook “off the panels” (when there is sufficient solar to support the load), so all other things being equal I tend to use more power on average with the larger array.
voluntary reduction
Conversely, I limit my use of non-critical power when the system is struggling. My goal is to help the system hold Vabs/Vfloat.
- battery powered lighting rather than 12v lighting
- chromebook rather than power-hungry laptop
- lower fan speeds
- wait to pump water into Brita, etc
automatic reduction
Some of the austerity is automatic. I run an opportunity circuit in the van that runs loads only when there is excess power, so they shut off automagically if we drop below Vfloat.
conclusion
The model is useful, particularly for “sanity checking” newbies’ proposed setups at their geographic location.
On paper there appears to be little benefit to upgrading from 570w to 750w;1 in Real Life the bigger system allows me to run bigger loads longer. It also provides a bit more support under poor insolation.
1 really from 380w to 750w since the upgrade was instigated by damage to one of the 190w panels.
comments
twitter comment thread for this post